Đây là một entry đáng đọc nữa cho giới Investment Analysis của GS Damodaran.
Key notes:
Thông thường, P/E cao đi với rủi ro thấp, P/E thấp đi với rủi ro cao. Nhưng điều đó có thể sẽ không đúng trong một số trường hợp. Chính vì vậy, khi xem xét quyết định đầu tư dựa vào P/E chúng ta phải xem kèm với ERP.
Còn về P/B, khi đầu tư dựa vào P/B, nhà đầu tư cần phải xem xét thêm xem, liệu thị trường đó có P/B thấp nhưng có phải là do ROE của thị trường đó quá kém không?
Các bạn còn nhớ công thức này chứ?
P/B = (LNST/VCSH-g)/(r-g) = (LNST-g*VCSH)/[VCSH*(r-g)] = D1/[BV*(r-g)]
Có những thị trường có P/B thấp nhưng ROE lại rất cao như Zimbabwe chẳng hạn, tốt đấy, nhưng cần phải xem xét yếu tố thanh khoản nữa nhé.
KL: Sau khi xem xét những chỉ tiêu định giá so sánh, dường như chúng ta đã phát hiện ra những thị trường tiềm năng, những thị trường có định giá rẻ mà rủi ro lại thấp, hay có mức độ sinh lời trên vốn cao. Nhưng cần phải xem xét thêm rủi ro về chính trị
-----------------------------------------------------------
Market Multiples: Global Comparison and Analysis
In my last two posts, I looked first at measures of country risk, both from a default risk and an equity market perspective, and then at stock pricing, using earnings and book value multiples, across developed and emerging markets. In summary, the conclusion that I drew was that the shift away from emerging markets in the last six months may be obscuring a much larger shift towards convergence between emerging and developed markets over the last decade. Thus, we can debate whether this convergence is rational or overdone (quá trớn), but it is quite clear that stock markets around the world have more in common now than they are different. Having said this, it is worth noting that the developed and emerging market categories that I used in the last post, which were based on geographic location, may no longer reflect the reality that there is vastly more diversity within each region than there used to be. In this post, I intend to look at the pricing of stocks, by country, not only to illustrate this diversity but also to look for mis pricing, at a country level, around the globe.
PE Ratios around the globe
The price earnings ratio, notwithstanding its volatility and measurement weaknesses, remains among the most widely used tools in investing. In fact, some global investors still compare PE ratios across countries and often direct their money towards countries with low PE ratios, on the presumption that this must indicate "cheapness".
To put this approach into practice, I first computed PE ratios in June 2013, by country. During the computation, I noted a couple of phenomena (hiện tượng), which while unsurprising, are still worth emphasizing. The first is that almost 60% of all companies globally have negative earnings and PE ratios are thus not meaningful for these companies. The second is that there are significant outliers, with a few companies with exceptionally high PE ratios (usually because earnings have dropped to close to zero) pulling the averages to high numbers, especially in countries with relatively few companies. To get a more representative value (giá trị đại diện), I computed the PE ratio based on aggregate values for market capitalization and net income. Put simply, I summed up the market capitalization of all the companies in a market and divided by the total net income of all companies in a market. This aggregate value is not as sensitive to outliers and reflects more closely a weighted average of the companies in the market, with values representing the weights.
The heat map below allows you to compare PE ratios across countries, and within regions.
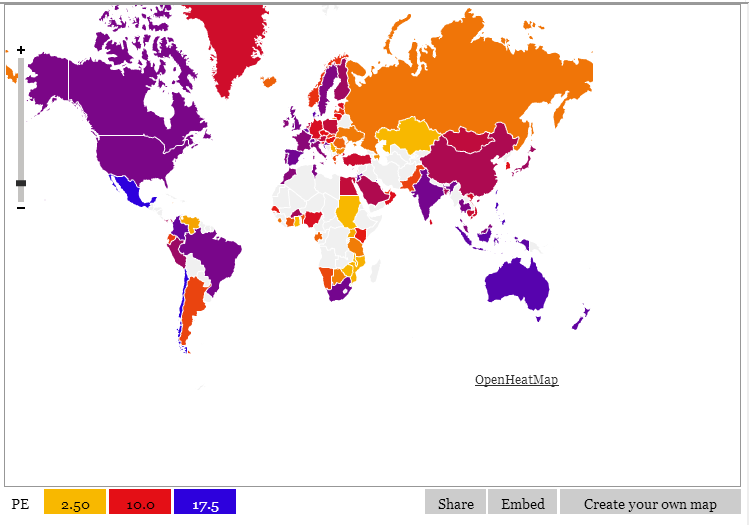
Note that the countries with the lowest PE ratios (in yellow and orange) are also among the world's riskiest (a large swath of Africa, Venezuela (Latin America) and Eastern Europe). Put differently, these countries look cheap, but they have good reasons to be cheap. The bulk of developed markets (phần lớn thị trường phát triển) have PE ratios between 10 and 15, with the weighted PE ratio at 10.49 for Germany, 12.81 for Japan and 14.27 for the US. Surprisingly, Mexico and Chile have the highest weighted PE ratios, with Mexico at 18.04 and Chile at 18.64. There are also large sections of the world where PE ratios cannot be computed, either because earnings information is not available or because earnings are negative.
If most of the low PE countries are high risk and the bulk of the high PE countries are low risk, we have to use more finesse (khéo léo) in looking for cheap and expensive markets. In fact, a cheap market would offer a combination of a low PE and low risk and an expensive market would be one with high PE and high risk. To look for those mismatches, I combined the PE ratio dataset with the equity risk premiums estimated in the prior blog post and generated a list of the ten countries with the highest and lowest PE ratios, with accompanying equity risk premiums.

Of the ten countries with the lowest PE ratios, only two (Kazakhstan and Azerbaijan) had equity risk premiums less than 10% and I can not tempted (cám dỗ) to invest in either country (given their dependence on commodity prices and political risk profiles). There are more interesting countries on the highest PE list, though a couple reflect commodity price volatility; the drop in copper prices, for instance, has hit Chilean company earnings harder than it has market capitalizations.
Price to Book Ratios
The price to book ratio is often a less volatile and more reliable measure of pricing in a market. While accounting choices can affect book value, the effects of these choices are more muted than on earnings. As with PE ratios, I computed both the average price to book ratios and price to book ratios based upon aggregate market capitalization and book equity and decided to use the latter as the indicator of overall pricing. The map below provides comparisons of the aggregate price to book ratio across the globe:
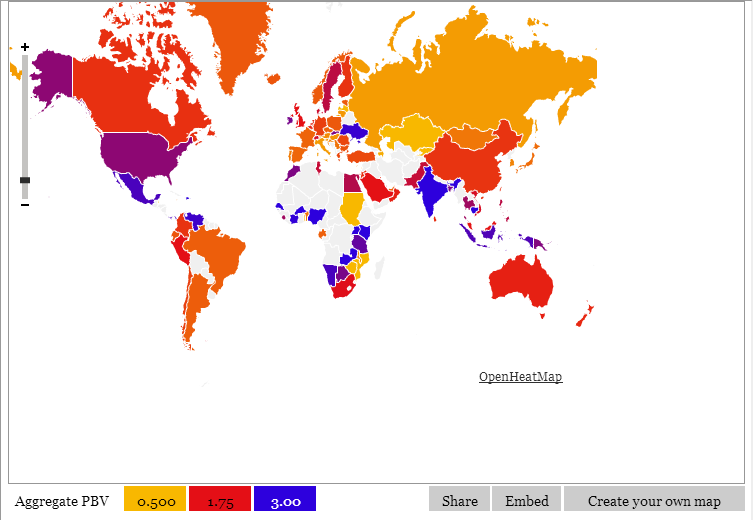
Unlike PE ratios, there seems to be little relationship between the dispersion (phân tán) of price to book ratios across the globe and country risk. Some of the highest price to book ratios are in the riskiest countries: Namibia, Indonesia and Venezuela all have price to book ratios that exceed 2.50 and are all high risk countries.
As with PE ratios, a naive strategy (chiến lược ngây thơ) of directing your money to the countries with the lowest price to book ratios may be dangerous, since these low multiples of book value can be explained by low returns on equity. The following is a list of the ten countries with the highest and lowest price to book ratios:

Note that the countries with the highest price to book ratios also tend to have very high returns on equity, whereas some of the countries on the lowest price to book ratios have negative or low returns on equity. There are some mismatches, especially on the low PBV list, with Zimbabwe, Lebanon and Russia joining Kazakhstan and Azerbaijan as markets with low price to book ratios and high returns on equity. In addition to all the caveats (careful) about hidden (and not so hidden) risks, it is also worth noting that some of these markets have only a handful of listings and no or low liquidity.
Enterprise Value to EBITDA multiples
Some investors and analysts take issue with equity multiples, arguing that they do not account for overall value and leverage. Consequently, I estimated enterprise value to EBITDA multiples for individual countries, using both simple averages and aggregated values. The resulting global map of EV to EBITDA multiples is below:
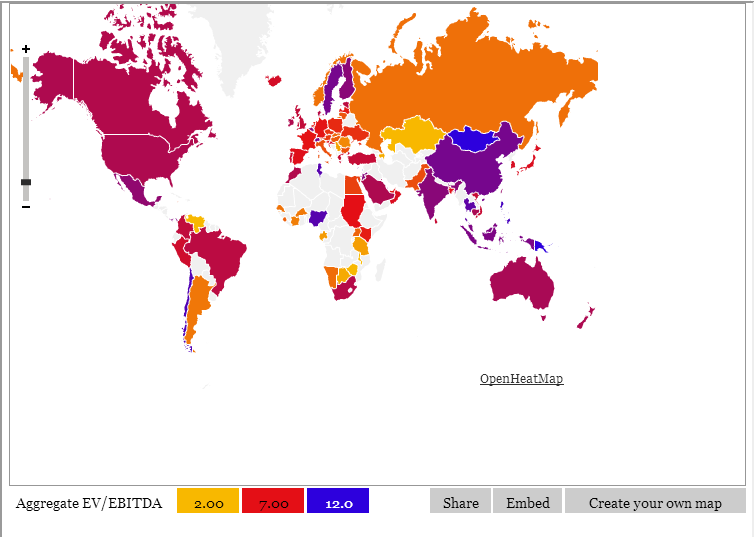
This map more closely corresponds to the PE map, with riskier countries having lower EV to EBITDA multiples (with Mongolia being an exception). The median value across the globe is 8.03, with the United States (8.45), Australia (8.59), India (9.48) and China (9.99) trading above the value and much of Western Europe trading below.
Just as I balanced PE ratios against risk and PBV against ROE, I brought in return on invested capital (ROIC) into the comparison of EV/EBITDA multiples, on the assumption that higher ROIC is more likely to accompany higher EV/EBITDA multiples. Again, the list of countries with the highest and lowest EV/EBITDA multiples, with ROIC for each, is in the list below:

Unlike with equity multiples, the relationship between ROIC and EV/EBITDA is in the inverse of expectations, with countries with the higher (lower) returns on invested capital having the lowest (highest) EV/EBITDA multiples.
Wrapping up
At the end of the comparisons of equity and enterprise value multiples, I must confess (thú nhận) that I feel little inclination (1 chút mong muốn) to make abrupt asset allocation judgments (điều chỉnh sự phân bổ tài sản đột ngột) based upon any of these multiples. It is true that some markets seem to offer better risk and return trade offs than others, but these markets seem to come with warning labels (about political or commodity price risk). It is also possible that I am missing some hidden patterns here and you are welcome to download the dataset containing my estimates of both average and aggregate values, by country.
Notwithstanding the noise in the numbers, I am glad that I was able to look at the numbers across countries. I feel a little more informed about how stocks are being priced across the globe and how investors are pricing in the most extraordinary and unusual risks in some markets. I also realize how much I have left to learn about how stocks are priced in countries with non-traditional risks and will keep working at filling in the gaps in my knowledge.
Nguồn: finandlife|Damodaran