Use economic signals to see what investments may shine at what turn in the business cycle.
Although every business cycle is different, our historical analysis suggests that the rhythm (nhịp điệu) of cyclical fluctuations in the economy has tended to follow similar patterns. Moreover, performance across asset categories typically rotates in line with different phases of the business cycle. As a result, a business cycle approach to asset allocation can add value as part of an intermediate-term investment strategy.
Understanding the business cycle
Every business cycle is different in its own way, but certain patterns have tended to repeat themselves over time. Fluctuations in the business cycle are essentially distinct changes in the rate of growth in economic activity, particularly changes in three key cycles—the corporate profit cycle, the credit cycle, and the inventory cycle—as well as changes in the employment backdrop and monetary policy. While unforeseen macroeconomic events or shocks can sometimes disrupt (phá vỡ) a trend, changes in these key indicators historically have provided a relatively reliable guide to recognizing the different phases of an economic cycle. Our quantitatively backed, probabilistic approach helps in identifying, with a reasonable degree of confidence, the state of the business cycle at different points in time. Specifically, there are four distinct phases of a typical business cycle (see chart, below):
• Early-cycle phase: Generally a sharp recovery from recession, marked by an inflection from negative to positive growth in economic activity (e.g., gross domestic product, industrial production), then an accelerating growth rate. Credit conditions stop tightening amid easy monetary policy, creating a healthy environment for rapid margin expansion and profit growth. Business inventories are low, while sales growth improves significantly.
• Mid-cycle phase: Typically the longest phase of the business cycle. The mid-cycle is characterized by a positive but more moderate rate of growth than that experienced during the early-cycle phase. Economic activity gathers momentum, credit growth becomes strong, and profitability is healthy against an accommodative—though increasingly neutral—monetary policy backdrop. Inventories and sales grow, reaching equilibrium (sự cân bằng) relative to each other.
• Late-cycle phase: Emblematic (/ˌembləˈmætɪk/ adj formal seeming to represent or be a sign of something; biểu tượng, tượng trưng) of an “overheated” economy poised to slip into recession and hindered by above-trend rates of inflation. Economic growth rates slow to “stall speed” against a backdrop of restrictive monetary policy, tightening credit availability, and deteriorating corporate profit margins. Inventories tend to build unexpectedly as sales growth declines.
• Recession phase: Features (=emblematic) a contraction in economic activity. Corporate profits decline and credit is scarce for all economic factors. Monetary policy becomes more accommodative and inventories gradually fall despite low sales levels, setting up for the next recovery.
The business cycle has four distinct phases, with the example of the U.S. in a mid-cycle expansion in mid-2014.
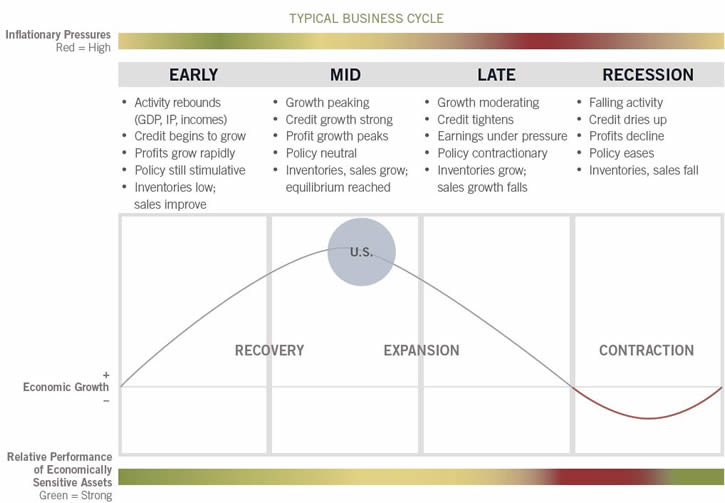
Note: This is a hypothetical illustration of a typical business cycle. There is not always a chronological progression in this order, and there have been cycles when the economy has skipped a phase or retraced an earlier one. Economically sensitive assets include stocks and high-yield corporate bonds, while less economically sensitive assets include Treasury bonds and cash. Please see endnotes for a complete discussion. Source: Fidelity Investments (AART).
Asset class performance patterns
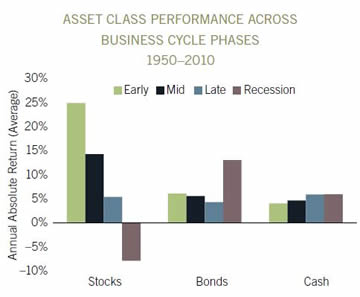
Historically, performance for stocks and bonds has been heavily influenced by the business cycle.
Past performance is no guarantee of future results. Asset class total returns are represented by indexes from the following sources: Fidelity Investments, Ibbotson Associates, Barclays, as of Jul. 31, 2014. Source: Fidelity Investments proprietary analysis of historical asset class performance, which is not indicative of future performance.
Looking at the performance of stocks, bonds, and cash from 1950 to 2010, we can see that shifts between business cycle phases create differentiation in asset price performance (see chart, right). In general, the performance of economically sensitive assets such as stocks tends to be the strongest when growth is rising at an accelerating rate during the early cycle, then moderates through the other phases until returns generally decline during recessions. By contrast, defensive assets such as investment-grade bonds and cash-like short-term debt have experienced the opposite pattern, with their highest returns during a recession and the weakest relative performance during the early cycle.
Asset allocation decisions are rooted in relative asset class performance, and there is significant potential to enhance portfolio performance by tilting exposures to the major asset classes based on shifts in the business cycle. Investors can implement the business cycle approach to asset allocation by overweighting asset classes that tend to outperform during a given business cycle phase, while underweighting those asset classes that tend to underperform. In the early cycle, for example, the investor using this approach would overweight stocks and underweight bonds and cash.
In the analysis that follows, we consider asset class performance patterns across the phases of the business cycle, both on an absolute basis and using several measures relative to a long-term strategic allocation to a balanced benchmark portfolio of 50% stocks, 40% bonds, and 10% cash (see “Analyzing relative asset class performance,” below). Business cycles since 1950 are represented, and all data are annualized for comparison purposes.
Analyzing relative asset class performance
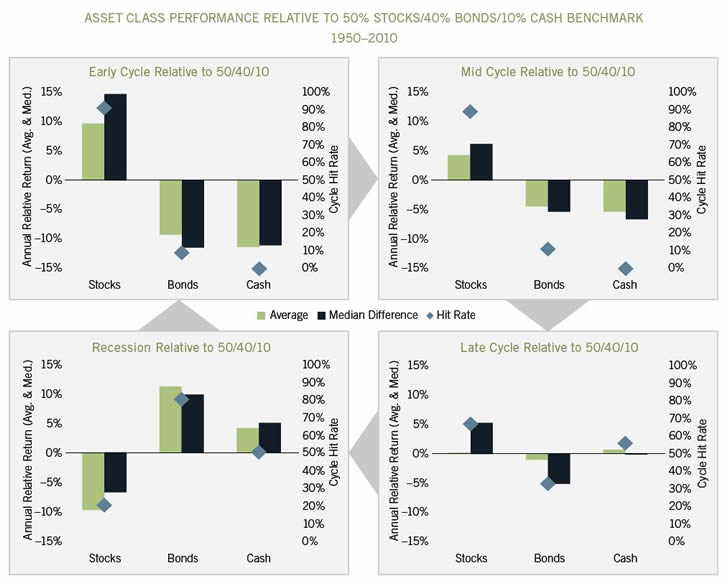
Certain metrics help us evaluate the historical performance of each asset class relative to the strategic allocation by revealing the potential magnitude of out- or underperformance during each phase, as well as the reliability of those historical performance patterns (see chart, below).
• Full-phase average performance: Calculates the (geometric) average performance of an asset class in a particular phase of the business cycle and subtracts the performance of the benchmark portfolio. This method better captures the impact of compounding and performance that is experienced across full market cycles (i.e., longer holding periods). However, performance outliers may skew results.
• Median monthly difference: For each month, calculates the difference in the performance for an asset class compared to the benchmark portfolio, and then takes the midpoint of those observations. This measure is indifferent to when a return period begins during a phase, which makes it a good measure for investors who may miss significant portions of each business cycle phase. This method mutes the extreme performance differences of outliers, and also underemphasizes the impact of compounding returns.
• Cycle hit rate: Calculates the frequency of an asset class outperforming the benchmark portfolio over each business cycle phase since 1950. This measure represents the consistency of asset class performance relative to the broader market over different cycles, removing the possibility that outsized gains during one period in history influence overall averages. This method suffers somewhat from small sample sizes, with only 10 full cycles during the period, but persistent out- or underperformance can still be observed.
Early-cycle phase
Lasting an average of about one year, the early phase of the business cycle has historically produced the most robust stock performance on an absolute basis (see chart, below). Stocks have typically benefited more than bonds and cash from the backdrop of low interest rates, the first signs of economic improvement, and the rebound in corporate earnings. Relative to the long-term strategic allocation, stocks have exhibited (trưng ra) the greatest outperformance in the early cycle, while bonds and cash have experienced the deepest underperformance (see chart below). A hallmark (dấu hiệu) of this phase is that hit rates against the balanced benchmark are the most definitive, which may give investors greater conviction to (tin để) overweight riskier assets and underweight more defensive asset classes during the early cycle.
Relative to a balanced benchmark, economically sensitive stocks have tended to do well in the early- and mid-cycle phases, bonds have tended to do well in the recessionary phase, and performance has been mixed during the late-cycle phase.
Past performance is no guarantee of future results. Asset class total returns are represented by indexes from the following sources: Fidelity Investments, Ibbotson Associates, Barclays, as of Jul. 31, 2014. Source: Fidelity Investments proprietary analysis of historical asset class performance, which is not indicative of future performance.
Mid-cycle phase
Averaging nearly three years, the mid-cycle phase tends to be significantly longer than any other phase of the business cycle. As the economy moves beyond its initial stage of recovery and growth rates moderate during the mid-cycle, the leadership of economically sensitive assets has typically tapered. On an absolute basis, stock market performance has tended to be fairly strong though not as robust as in the early-cycle phase, while bonds and cash have continued to post lower returns than equities in the mid-cycle. This phase is also when most stock market corrections have taken place. Measured by average and median differences as well as hit rates, the mid-cycle pattern of performance relative to the strategic allocation is similar to that of the early cycle, with bonds and cash trailing stocks. However, both the magnitude and frequency of out- and underperformance have been more muted, justifying more moderate portfolio tilts (độ nghiêng) than during the early phase.
Late-cycle phase
The late-cycle phase has an average duration of roughly a year and a half. As the recovery matures, inflationary pressures build, interest rates rise, and investors start to shift away from economically sensitive areas. On an absolute basis, average stock performance is roughly in line with cash. The rising interest rates that typically accompany this phase of the business cycle tend to weigh on the performance of longer-duration bonds, which lags the absolute returns to shorter-duration cash. Across the asset classes, the late cycle has the most mixed performance relative to the strategic allocation, and the hit rates and relative performance are the lowest of the expansion phases. In general, stocks have exhibited somewhat better performance on some metrics during the late cycle, and cash tends to outperform bonds, but the indefinite frequency and magnitude of relative performance warrant more neutral allocations relative to the benchmark portfolio.
Recession phase
The recession phase has historically been the shortest, lasting nine months on average from 1950 to 2010. As economic growth stalls and contracts, assets that are more economically sensitive fall out of favor, and those that are defensively oriented move to the front of the performance line. The stock market has performed poorly during this phase. Cash has continued to play a defensive role, while the falling interest-rate environment typically seen during recessions acts as a major tailwind (a wind blowing in the same direction that something or someone is travelling) for bonds. Performance patterns relative to the strategic allocation have been significantly different in recessions than in the other three phases, most notably in the high frequency of outperformance for bonds, and the opposite for stocks. Cash positions also enjoy their best performance relative to the balanced benchmark, albeit with only moderate hit rates. This phase of the business cycle tends to favor a high conviction in more defensive allocations.
Sector performance rotations within asset classes
Equity sector relative performance has tended to be differentiated across business cycle phases.
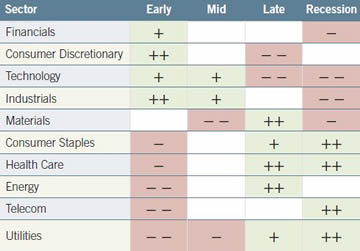
Unshaded (white) portions above suggest no clear pattern of over- or underperformance vs. broader market. Double +/– signs indicate that the sector is showing a consistent signal across all three metrics: full-phase average performance, median monthly difference, and cycle hit rate. A single +/– indicates a mixed or less consistent signal. Source: Fidelity Investments (AART).
Similar patterns of relative performance can be identified across sectors of the major asset classes, such as equity sectors or different credit qualities in the fixed income universe. Within equity markets, more economically sensitive sectors such as technology and industrials tend to do better in the early- and mid-cycle phases, while more defensively oriented sectors such as consumer staples and health care have historically exhibited better performance during the more sluggish economic growth in the late-cycle and recession phases (see chart, right, and Viewpoints article “Sector investing: business cycle approach,” Sep. 2014).
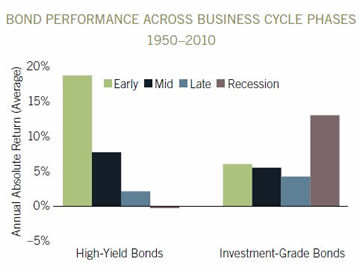
Bond market sectors have also exhibited economic sensitivity. More credit-sensitive fixed-income sectors (such as high-yield corporate bonds) have tended to do better in the early phase of the cycle, while less economically sensitive areas (such as government and other investment-grade bonds) have done relatively well in slowdowns and recessions. For instance, high-yield corporates have averaged strong annual gains during the early cycle but have been roughly flat in recessions, when interest rate-sensitive investment-grade bonds have exhibited solid positive returns. Many fixed-income categories that are fairly new to the marketplace have limited history and hence smaller sample sizes that make historical performance analysis less useful. Nevertheless, comparing the performance of credit and interest-rate sensitive bonds across the phases illustrates that business cycle-based asset allocation within a fixed income portfolio has considerable potential to generate active returns (see chart, above).
Merits of the business cycle approach
The economic sensitivity of high-yield bonds has caused them to behave more like equities than investment-grade bonds.
Past performance is no guarantee of future results. Asset class total returns are represented by indexes from the following sources: Fidelity Investments, Bank of America Merrill Lynch, Ibbotson Associates, Barclays, as of Jul. 31, 2014. Source: Fidelity Investments proprietary analysis of historical asset class performance, which is not indicative of future performance.
There is generally broad agreement among many academics and market participants that economic factors influence asset prices. However, while academic research has shown that asset allocation decisions can be responsible for anywhere between 40% and 90% of return variability among portfolios, there is still debate over the best way to incorporate economic factors into asset allocation approaches.1
Other business cycle approaches
Some approaches feature economic indicators as important drivers. One of the most widely used paradigms for economically linked asset allocation decisions is to specify the economy as being in one of two states, expansion or contraction. The National Bureau of Economic Research (NBER) is generally considered to be the official arbiter of U.S. recessions, and its methodology tends to be either wholly or partly borrowed by market participants. Because recessions have generally experienced significant differentiation among asset class performance relative to the rest of the cycle, the NBER’s dating scheme has historically offered solid opportunities for active asset allocation.
However, many of these economic approaches have significant shortcomings. First, some may have a strong theoretical backing but lack the ability to be practically applied, often relying on data that are revised frequently or not released on a timely basis. For instance, the NBER announced the beginning of the most recent recession a full 12 months after the fact. Second, the binary approach is not granular enough to catch major shifts in asset price performance during the lengthy expansion phase, which reduces the potential for capturing active returns.
Other asset allocation paradigms also include market-based asset price signals. These tend to shift phase identifications more quickly than models based purely on the economy, likely due to the fast pace of asset market price movements. For example, one prominent strategy uses earnings yield—a function of corporate profits and stock prices—and recent stock market returns as primary inputs to an asset allocation model, which at times has shifted through all four phases in a one- or two-year period. While such strategies may capture more trading opportunities than the more economically based models, frequent portfolio composition changes often generate higher turnover and transaction costs. Those strategies based more on asset price movements also have a greater likelihood of being whipsawed by price volatility, and they can be susceptible to false signals based on temporary investor optimism or pessimism.
Some alternative asset allocation approaches center on forecasting gross domestic product (GDP) and inferring asset market performance from those forecasts, but historical analysis has shown a relatively low correlation between GDP growth rates and stock or bond market investment rates of return over a cyclical time frame.
Our approach to business cycle investing
Our quantitatively backed, probabilistic approach encompasses a number of key attributes:
First, the approach focuses on critical drivers of relative asset performance. As demonstrated above, there is a large differential in asset performance across the various phases of the business cycle. A key to identifying the phase of the cycle is to focus on the direction and rate of change of key indicators, rather than the overall level of activity. We focus on economic indicators that are most closely linked with asset market returns, such as corporate profitability, the provisioning of credit throughout the economy, and inventory buildups or drawdowns across various industries.
Second, we employ a practical and repeatable framework that provides a solid foundation and can be applied more consistently. Our business cycle dating scheme measures high-quality indicators that have a greater probability of representing economic reality and are not dependent on perfect hindsight. For instance, tangible measures such as inventory data are less likely to be revised or present false signals compared to other, broader indicators such as GDP growth. We use a disciplined, model-driven approach that helps minimize the behavioral tendency to pay too much attention to recent price movements and momentum, called the extrapolation bias, which is a common pitfall suffered by many investors.
Third, the cycle phases we employ are grounded in distinct, intermediate-term fundamental trends, typically only shifting over periods of several months or longer. This approach unfolds more slowly than tactical approaches, whose frequent shifts can whipsaw investors during periods of high volatility. Our approach is best suited to strategies with an intermediate-term time horizon and a lower ability or willingness to trade into and out of positions quickly. On the other hand, this approach captures more frequent phases than the two-state NBER strategies, thus providing more scope for generating active returns.
Other considerations
Like any other approach, our business cycle approach has limitations and requires adept interpretation in order to use the framework appropriately as part of an investment strategy. For example, identifying the current phase of the business cycle determines the underlying trend of economic activity, but that trend can always be disrupted by an exogenous shock, such as natural disasters, geopolitical events, or major policy actions. A number of factors, including a relatively slow pace of expansion or a heavy dependence on other economies or external drivers of growth, may make an economy more susceptible to such a shock. For example, Japan’s slow pace of growth since 1990 has made its economy more inclined to move quickly through the business cycle phases and more frequently into and out of recession. Meanwhile, Germany’s dependence on exports makes its business cycle more susceptible to changes in the global business cycle.
It is also important to note that we draw a distinction between developed and developing economies when mapping their business cycles. For developed economies such as the U.S., we use the classic definition of recession, involving an outright contraction in economic activity. For developing economies, we define a recession as a “growth recession.” A growth recession is a significant decline in activity relative to a country’s long-term economic potential. We adopt this definition because developing countries tend to exhibit strong trend performance driven by rapid factor accumulation and increases in productivity, and the deviation from the trend tends to matter the most for asset returns—even if there is no outright contraction in activity.
Investment implications
As a result, complementing the business cycle approach with additional strategies may further enhance the ability to generate active returns from asset allocation over time. For instance, tactical shifts in portfolio positioning may be used to mitigate the risks or opportunities presented either by the threat of external shocks or by major market moves that may be unrelated to changes in the business cycle. Another possibility is to analyze the domestic business cycle combined with the business cycles of major trading partners or the entire world, in order to capture more of the exogenous risks facing an economy.
Using additional complementary strategies may be particularly relevant during phases when the relative performance differential from the business cycle framework tends to be more muted. For example, performance differences have been less pronounced during the late-cycle phase among stocks, bonds, and cash, or the mid-cycle for equity sector relative performance. During these phases, it may make sense to take fewer active allocation tilts based on the business-cycle approach compared with other strategies.
Every business cycle is different, and so are the relative performance patterns among asset categories. However, by using a disciplined business cycle approach, it is possible to identify key phases in the economy’s natural ebb and flow. These signals can provide the potential to generate incremental returns over the intermediate term, and they can be incorporated into an asset allocation framework that analyzes underlying factors and trends across various time horizons.
Nguồn: finandlife|www.fidelity.com