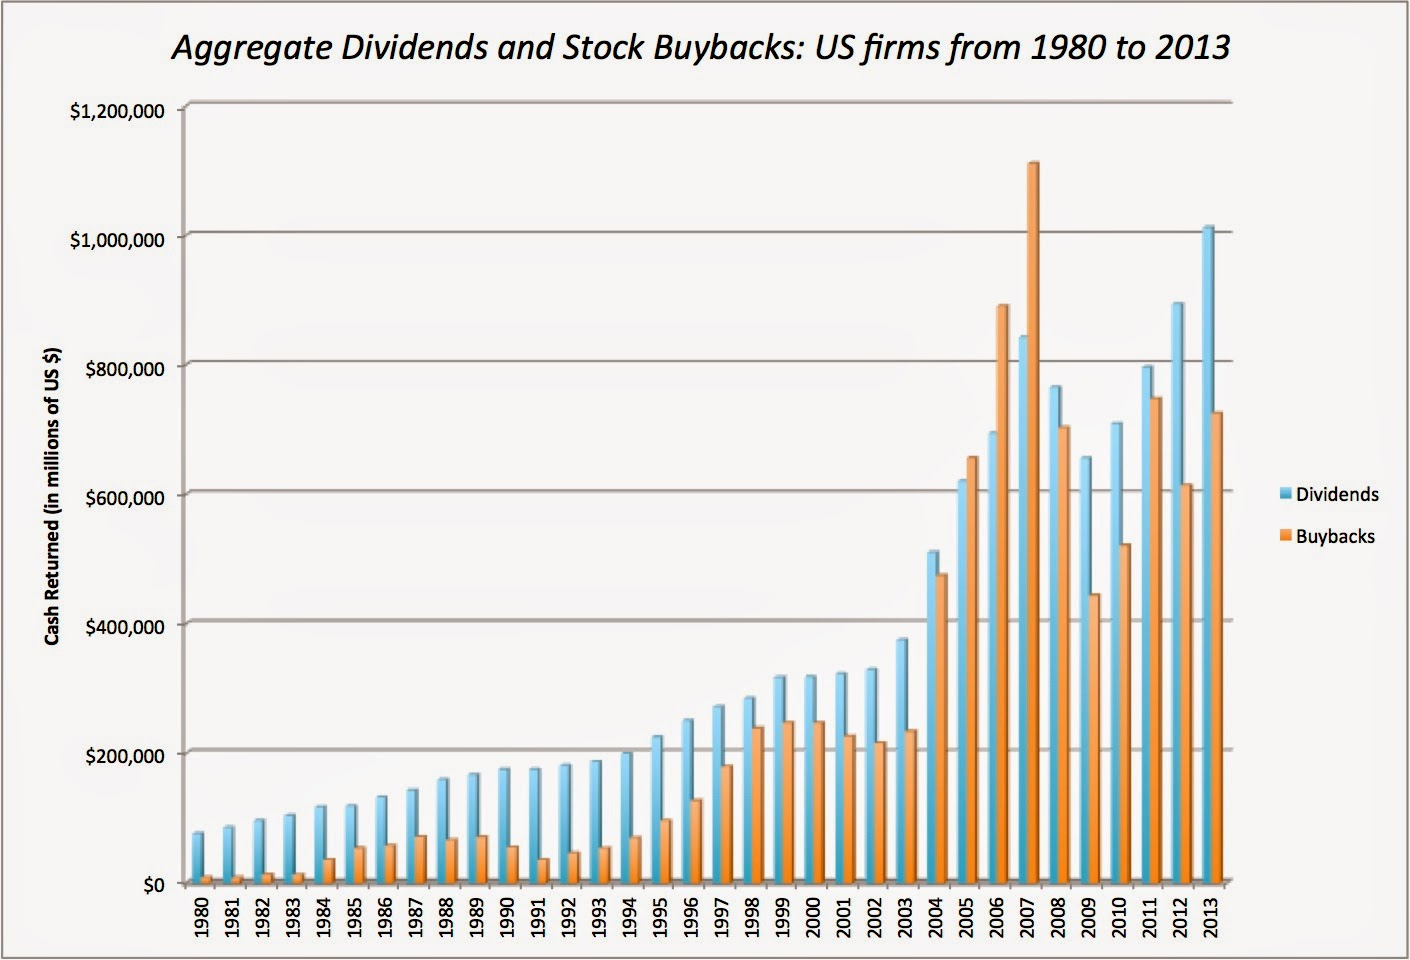
Biểu đồ này kể lại câu chuyện mua lại cổ phiếu tại những công ty Mỹ. Trong khi cổ tức tiền mặt thường được sử dụng trong thập niên 80 của thế kỷ trước, thì từ thập niên 90 trở đi bắt đầu có sự dịch chuyển sang mua lại cổ phiếu, và tổng số lượng mua lại đã chạp đến tổng cổ tức tiền mặt đã được chi trả trong 10 năm qua.
Hãy giữ mọi việc đơn giản: Mua lại cổ phiếu là một dạng trả tiền lại cho người nắm giữ cổ phiếu
Có 2 cách để trả tiền lại cho cổ đông. Thứ nhất là trả cổ tức bằng tiền mặt qua thời gian hoặc một dạng cổ tức đặc biệt nào đó. Cách thứ 2 là mua lại chính cổ phiếu của công ty. Có bốn khác biệt giữa 2 mô hình trả tiền lại cho cổ đông này.
1. Cổ tức có thể gây nên một thói quen, mua lại cổ phiếu lại không như thế: Nếu ta chi trả cổ tức, và tăng mức chi trả qua hàng năm, có thể tạo nên suy nghĩ năm sau phải cao hơn năm trước, và có thể gây áp lực cho công ty. Mua lại cổ phiếu lại không bị như thế, công ty có thể mua lại hàng tỷ USD giá trị cổ phiếu trong 1 năm, và không cần phải mua trong năm tiếp theo.
2. Mua lại cổ phiếu ảnh hưởng đến số lượng cổ phiếu, cổ tức thì không.
3. Chi trả cổ tức sẽ mang lại tiền cho tất cả cổ đông, trong khi đó, mua lại cổ phiếu chỉ trả tiền cho những người tự chọn lựa. Với hình thức trả cổ tức bằng tiền, tất cả nhà đầu tư đều nhận được cổ tức này, và không phân biệt gì cả. Trong khi đó, mua lại cổ phiếu sẽ làm trả lại tiền cho những người có quyết định bán lại cổ phiếu đó cho công ty, đồng thời tăng tỷ lệ sở hữu của những cổ đông còn lại tại cty.
4. Chi trả cổ tức và mua lại cổ phiếu sẽ tạo ra những hệ quả về thuế khác nhau: Luật thuế có thể đối xử khác nhau giữa cổ tức và lợi vốn cho cùng một lớp nhà đầu tư. Nhà đầu tư nhận cổ tức thì lượng cổ tức đó được tính gộp vào thu nhập trong năm của nhà đầu tư, và từ đó nó sẽ bị đánh thuế. Trong khi đó, mua lại cổ phiếu sẽ tác động đến thuế cho lợi vốn đối với những người bán cổ phiếu đó cho công ty, với những người còn giữ lại cổ phiếu thì chưa tính thuế, nó chỉ tính khi nhà đầu tư đó bán ra và có lãi.
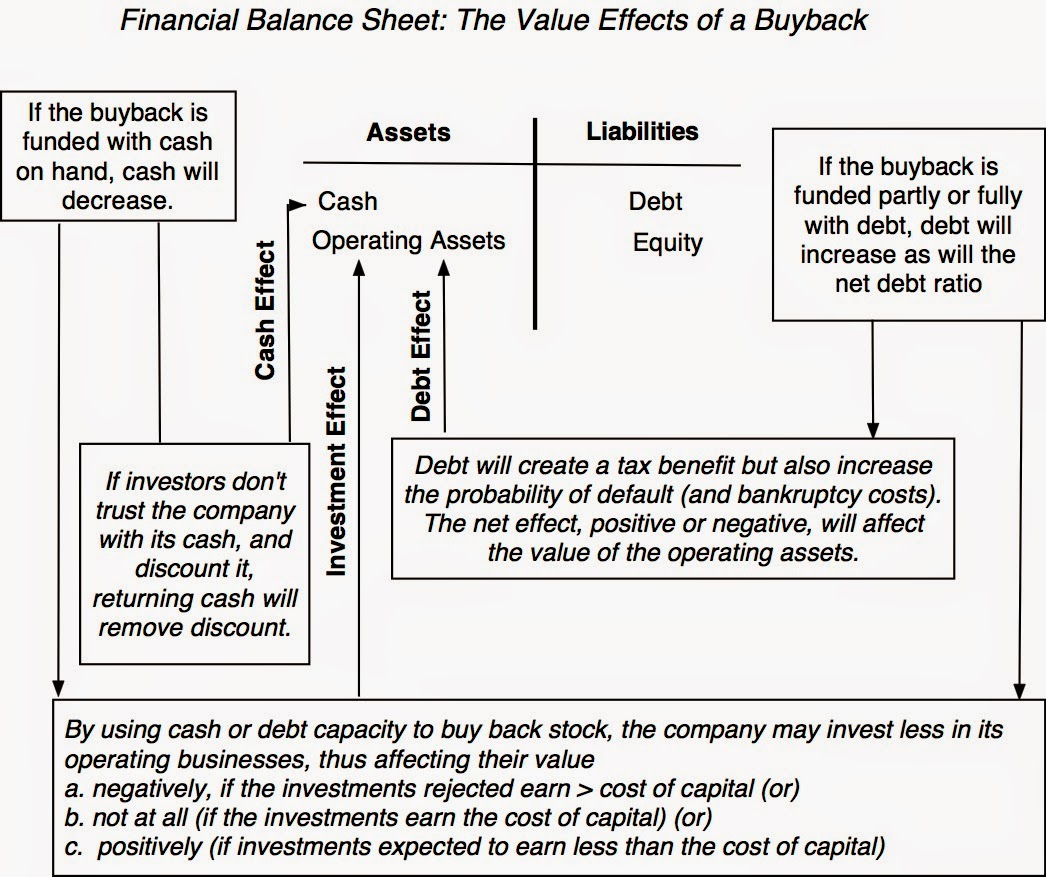
Mua lại cổ phiếu: Tác động lên giá trị công ty
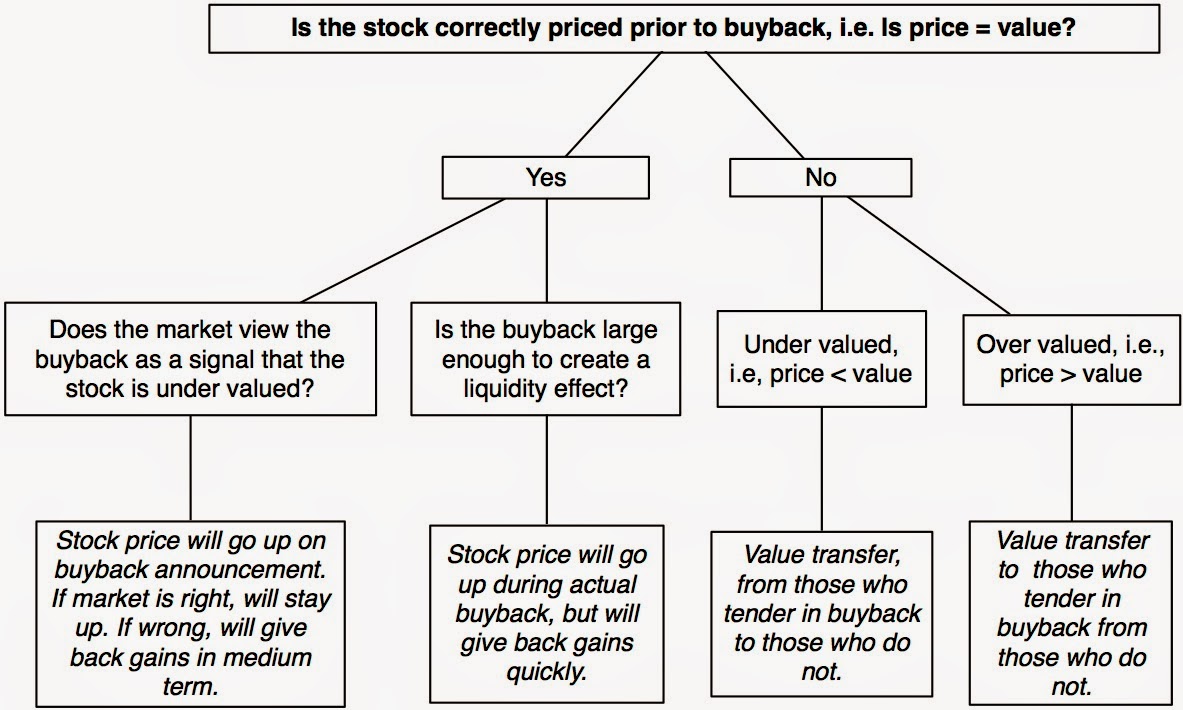
Mua lại cổ phiếu: Tác động lên giá cổ phiếu
---------------------------------
Stock Buybacks: They are big, they are back and they scare some people!
This has been a big year for stock buybacks, continuing a return to a trend that started more than two decades ago and was broken only briefly by the crisis in 2008. Focusing just on the S&P 500 companies, buybacks in the 2013 amounted to $475.6 billion, not quite as substantial as the best buyback year in history (2007, with $589.1 billion), but still significantly up since 2009. As stock prices rise and anxiety about bubbles and real economic growth also come to the surface, it is not surprising that some of those looking at rising prices are trying to make a connection, rightly or wrongly, to the buyout numbers. As a general rule, even insightful stories about buybacks tend to focus on one cause or effect of the buyback phenomenon but miss the big picture. In particular, there have two news stories about buybacks, one in the Economist and one in the Wall Street Journal. Since I talked to both journalists as they wrote these stories, and I am quoted in one of them, I should disclose that I like both writers and think they did their research, but their particular perspectives (that stock buybacks can be value destructive in the Economist and that they affect liquidity in the WSJ) may be blurring the big picture of buybacks. In fact, I think that the Economist overplayed their hand by calling buybacks “corporate cocaine”, a loaded header that treats buybacks as a destructive addiction (for which the cure, as with any other addiction, is abstinence). This post is not aimed at the vast majority of investors who sensibly view buybacks as good or bad on a company-by-company basis but at the shameless boosters of buybacks, who treat it as a magic bullet, at one extreme, and the equally clueless Cassandra chorus, who view it as the market equivalent of the Ebola virus, signaling the end of Western civilization as we know it, at the other.
Laying the Groundwork: Trends and History
For much of the last century, companies were not allowed to buy back stock, except in exceptional circumstances. In the United States, companies have been allowed to buy back stock for most of their existence, but the pace of buybacks did not really start picking up until the early 1980s, which some attribute to a SEC rule (10b-18) passed in 1982, providing safe harbor (protection from certain lawsuits) for companies doing repurchases. The legal rules governing buybacks in the US today are captured nicely in this Harvard Law School summary. In the graph below, I show aggregate stock buybacks and dividends at US companies going back to 1980.
This graph backs up the oft-told story of the shift to buybacks occurring at US companies. While dividends represented the preponderance of cash returned to investors in the early 1980s, the move towards buybacks is clear in the 1990s, and the aggregate amount in buybacks has exceeded the aggregate dividends paid over the last ten years. In 2007, the aggregate amount in buybacks was 32% higher than the dividends paid in that year. The market crisis of 2008 did result in a sharp pullback in buybacks in 2009, and while dividends also fell, they did not fall by as much. While some analysts considered this the end of the buyback era, companies clearly are showing them otherwise, as they return with a vengeance to buy backs.
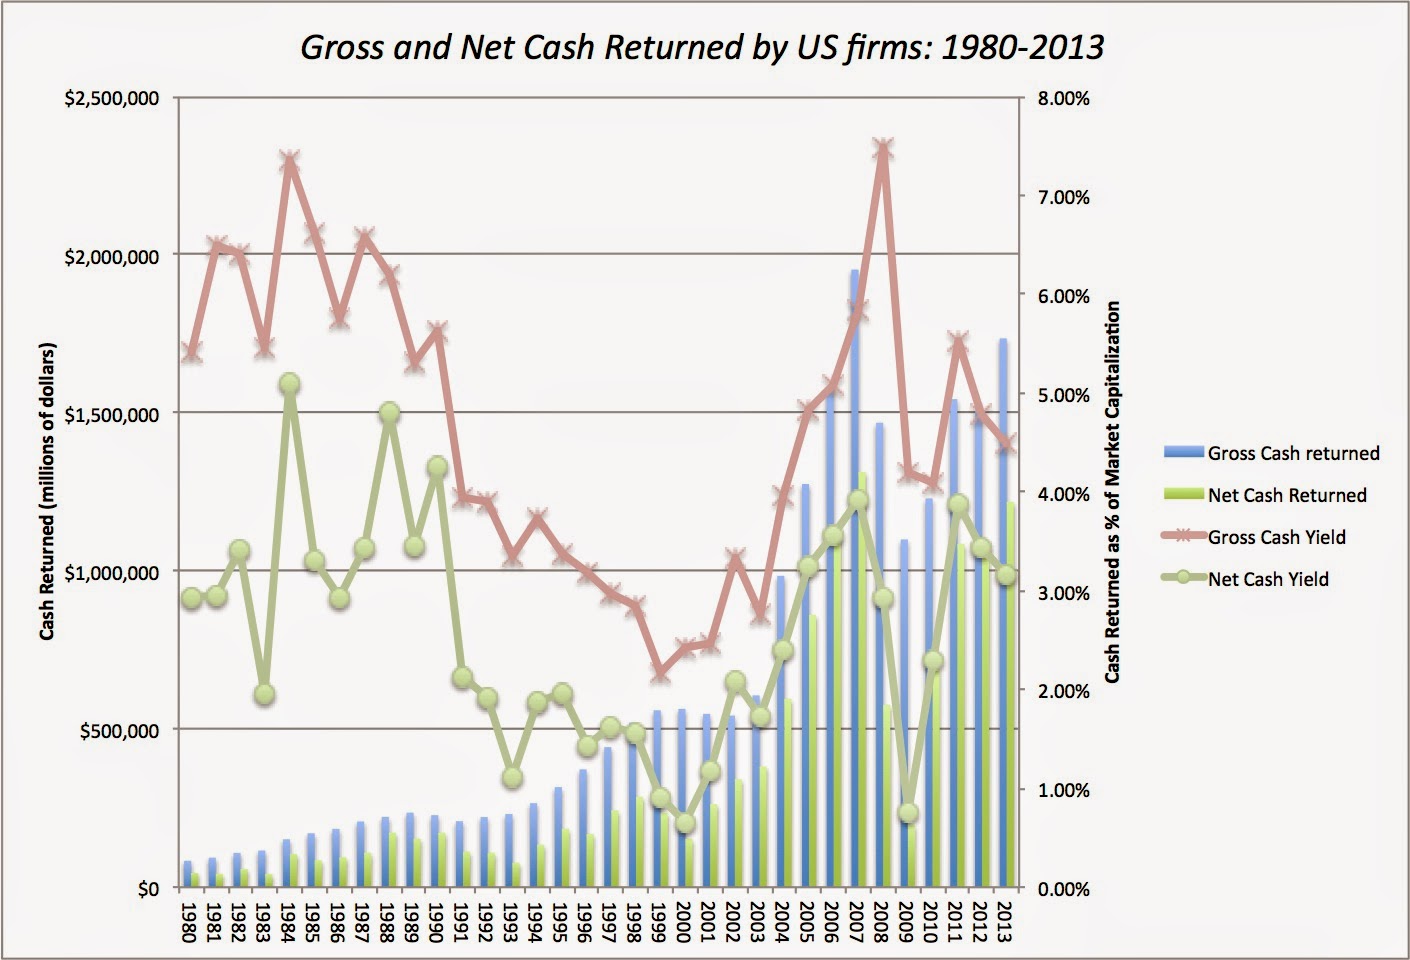
As some of those who have commented on my use of the total cash yield (where I add buybacks to dividends) in my equity risk premium posts have noted (with a special thank you to Michael Green of Ice Farm Capital, who has been gently persistent on this issue), the jump in cash returned may be exaggerated in this graph, because we are not netting out stock issues made by US companies in each year. This is a reasonable point, and I have brought in the stock issuances each year, to compute a net cash return each year (dividends + buybacks - stock issues) to contrast with the gross cash return (dividends + buybacks).
Note that I have converted all these numbers into yields, by dividing them by the aggregate market capitalization at the end of each year. Both the gross cash yield (5.53%) and net cash yield (3.89%) peaked in 2007, and the lowest values for these numbers were in 1999 and 2000, when the gross cash yield was 2.17% (1999) and the net cash yield was 0.67% (2000). At the end of 2013, the gross cash yield stood at 4.49% and the net cash yield at 3.16%, both slightly higher than the aggregate values of 4.24% for the gross yield and 2.46% for the net yield over the 1980-2013 time periods; the simple averages yield 4.65% for the gross yield and 2.60% for the net yield over the entire time period.
Since the aggregate values gloss over details, it is also worth noting who does the buybacks. It goes without saying that the largest buybacks (in dollar terms) are at the largest market cap companies, and the following is a list of the top fifteen companies buying back stock in 2013:
Not only is more money being returned in the form of buybacks, but the practice of buybacks has also now spread far and wide across the corporate spectrum, with small and large companies, as well as across different sectors, partaking in the phenomenon:
Other than utilities, the shift to dividends is clear in every other sector, with technology companies leading with almost 76% of cash returned taking the form of buybacks.
Keep it simple: Buybacks are a return of cash to stockholders
To understand buybacks, it is best to start simple. Publicly traded companies that generate excess cash often want to return that cash to stockholders and stockholders want them to do that. There are only two ways you can return cash to stockholders. One is to pay dividends, either regularly every period (quarter, semiannual or year) or as special dividends. The other is to buy back stock. From the company’s perspective, the aggregate effect is exactly the same, as cash leaves the company and goes to stockholders. There are four differences, though, between the two modes of returning cash.
1. Dividends are sticky, buybacks are not: With regular dividends, there is a tradition of maintaining or increasing dividends, a phenomenon referred to as sticky dividends. Thus, if you initiate or increase dividends, you are expected to continue to pay those dividends over time or face a market backlash. Stock buybacks don’t carry this legacy and companies can go from buying back billions of dollars worth of stock in one year to not buying back stock the next, without facing the same market reaction.
2. Buybacks affect share count, dividends do not: When a company pays dividends, the share count is unaffected, but when it buys back shares, the share count decreases by the number of shares bought back. Consequently, share buybacks do alter the ownership structure of the firm, leaving those who do not sell their shares back with a larger share in a smaller company.
3. Dividends return cash to all stockholders, buybacks only to the self-selected: When companies pay dividends, all stockholders get paid those dividends, whether they need or want the cash. Thus, it is a return of cash that all stockholders partake in, in proportion to their stockholding. In a stock buyback, only those stockholders who tender their shares back to the company get cash and the remaining stockholders get a larger proportional stake in the remaining firm. As we will see in the next section, this creates the possibility of wealth transfers from one group to the other, depending on the price paid on the buyback.
4. Dividends and buybacks create different tax consequences: The tax laws may treat dividends and capital gains differently at the investor level. Since dividends are paid out to all stockholders, it will be treated as income in the year in which it is paid out and taxed accordingly; for instance, the US tax code treated it as ordinary income for much of the last century and it has been taxed at a dividend tax rate since 2003. A stock buyback has more subtle tax effects, since investors who tender their shares back in the buyback generally have to pay capital gains taxes on the transaction, but only if the buyback price exceeds the price they paid to acquire the shares. If the remaining shares go up in price, stockholders who do not tender their shares can defer their capital gains taxes until they do sell the shares.
Buybacks: The Value Effect
Buybacks can have no effect, a positive effect or negative effect on equity value per share, depending on where the cash from the buyback is coming from and how it affects the firm’s investment decisions. To illustrate the effects, let’s start with a simple financial balance sheet (not an accounting one), where we estimate the intrinsic values of operating assets and equity and illustrate the effects of a stock buyback on the balance sheet.
Note that the buyback can be funded entirely with cash, partly with cash and partly with new debt or even entirely with debt. (I am going to leave out the perverse but not uncommon scenario of a company that funds a buyback with a new stock issue, since the only party that is enriched by that transaction is the investment banker who manages both the issuance and the buyback). The value of the operating assets can change, if the net debt ratio of the company changes after the buyback (thus affecting the cost of capital) or if the buyback reduces the amount that the company was planning to invest in its operating assets (thus changing the cash flows, growth and risk in these assets). This framework is a useful vehicle to look at the conditions under which buybacks have no effect on value, a positive one and a negative one.
The indifferent: For buybacks to have no effect on value, they should have no effect on the value of the operating assets. That must effectively mean that the buyback is entirely funded with cash off the balance sheet or that even if funded with debt, there is no net value effect (tax benefits cancel out with default cost) and that the buyback has no effect on how much the companyinvests back into its operating assets. As an example, consider the $13.2 billion in stock buybacks at Exxon Mobil in 2013. The company funded the buybacks entirely with cash surpluses and it not only had more than enough cash to cover reinvestment needs but continues to generate billions of dollars in excess cash (over and above its reinvestment needs).
The good: There are three pathways through with which a buyback can have a positive effect on value:
1. Discounted cash holdings: There are some companies with significant cash balances, where investors do not trust the management of the company with their cash (given the track record of the company). Consequently, they discount the cash in the hands of the company, on the assumption that they will do something stupid, and this stupidity discount can be substantial. This is one of the few scenarios where a stock buyback, funded with cash, is an unalloyed plus for stockholders, since it eliminates the cash discount on the cash paid out to stockholders.
2. Financial leverage effect: A firm that finances a buyback with debt, increasing its debt ratio, may end up with a lower cost of capital, if the tax benefits of debt are larger than the expected bankruptcy costs of that debt. That will occur only if the firm has debt capacity to begin with, but that lower cost of capital adds to the value of the operating assets, though it can be argued that it is less value enhancement and more of a value transfer (from taxpayers to stockholders).
3. Poor investment choices: There is also the scenario where a firm that has been actively investing in a bad business or businesses (earning less than the cost of capital) redirects the cash towards buybacks. Here, less investment is value increasing and I will let you be the judge on how many firms on the top fifteen list in 2013 fall into that scenario. (I can think of quite a few...)
The bad: There are two ways in which a buyback can have a negative effect on value. The first is if the firm is correctly or over levered and chooses to finance the buyback with even more debt, since that would push the cost of capital higher after the buyback (as the expected bankruptcy costs overwhelm the tax benefits of debt). The second is if the firm takes cash that would have been directed to superior investment opportunities (where the return on capital > cost of capital) and uses it to buy back stock; this requires that the company also face a capital constraint, imposed either internally (because the company does not like to raise new financing) or externally (because the company is prevented from raising new financing).
Buybacks: The Pricing Effect
If buybacks have no effect on value, can they still affect stock prices? Sure, and there are three possible factors that may cause the effect. The first is if there is a market mistake at play, where the stock is priced above or below its intrinsic value and the buyback occurs at a price that is not equal to the value. The second is that markets extrapolate from corporate actions and may view the buyback as a signal about what managers of the company think about its fair value. The third is that a buyback, especially if large and/or on a lightly traded stock, can have liquidity effects, tilting the demand side of the pricing equation. All of the effects are captured in the picture below:
1. Market mispricing: If the stock is mispriced before the buyback, the buyback can create a value transfer between those who tender their shares back in the buyback and those who remain as stockholders, with the direction of the transfer depending on whether the shares were over or under valued to begin with. If the price is less than the value, i.e., the stock is under priced, a buyback at the prevailing price will benefit the remaining shareholders, by letting them capture the difference but at the expense of the stockholders who chose to sell their shares back at the “low price”. In fact, it is likely that the market will view the announcement of the buyback as a signal that the stock is under valued and push the price impact in what is commonly categorized as a signaling effect. If the price is greater than the value, i.e., the stock is over priced, a buyback will benefit those who sell their shares back, again at the expense of those who hold on to their shares. In either case, there is no value creation but only a value transfer, from one group of stockholders in the company to another. Lest you feel qualms of sympathy for the losing group in either scenario, remember that most stockholders get a choice (to tender or hold on to the shares) and if they make the wrong choice, they have to live with the consequences.
2. Signaling: For better or worse, markets read messages into actions and then translate them into price effects. Thus, when companies buy back stock, investors may consider this to be a signal that these companies view their stock to be under valued. If there is a signaling effect, you should expect to see the stock price jump on the announcement of the buyback and not the actual execution. The problem with this signaling story is that it attributes information and valuation skills to the management of the company that is buying back stock, that they do not possess. The evidence on whether companies time stock buybacks well, i.e., buy back their stock when it is cheap, is weak. While there is some evidence that companies that buy back their own stock outperform the market in the months after the buyback, there is also evidence that buybacks peak when markets are booming and lag in bear markets.
3. Liquidity effects: A stock buyback, especially if it is of a large percentage of the outstanding shares, does create a liquidity effect, with the buy orders from the company pushing up the stock price. For this to occur, though, the shares bought back have to be a high percentage of the shares traded (not the shares outstanding). If there is a liquidity effect, you should expect to see the stock price rise around the actual buyback (and not the announcement) but that price effect should fade in the weeks after. While the Wall Street Journal makes legitimate points about how buybacks can sometimes tilt the liquidity playing field, looking across companies that buy back stock and scaling the buyback to the daily trading volume on the stock, the median value of buybacks as a percent of annual trading volume was 0.79% and the 75th percentile across all firms is 2.17%. It is true that there are firms like IBM and Pfizer that rank among the biggest buyback firms, where buybacks are a significant percentage of annual trading volume and there will be a liquidity effect at these companies, albeit short lived:
The Sum of the Effects
In summary, buybacks can increase value, if they lower the cost of capital and create a tax benefit that exceeds expected bankruptcy costs, and can increase stock prices for non-tendering stockholders, if the stock is under valued. Buybacks can destroy value if they put a company’s survival at risk, by either eliminating a cash buffer or pushing debt to dangerously high levels. They can also result in wealth transfer to the stockholders who sell back over those who remain in the firm, if the buyback price exceeds the value per share.
What about the share count effect? This is the red herring of buyback analysis, a number that looks profoundly meaningful at first sight but is useless in assessing the effect of a buyback, on deeper analysis. Let’s start with the obvious. A stock buyback will always reduce share count. For those lazy enough to believe that dilution is the bogeyman, and that less shares is always better than more, buybacks are always good news. However, lower share count often does not signify higher value per share and it may not even signify higher earnings per share (or whatever per share metric you use). For those slightly less lazy, focused on earnings per share, the assessment of whether a buyback is good news boils down to estimating how much earnings per share goes up after it happens. In a world where PE ratios stay constant, come out of sector averages, or are just made up, this will translate into higher price per share. The problem is that abuyback alters the risk profile of a firm and should also change its PE ratio (usually to a lower number).
To assess the effect of a buyback, you have to consider the full picture. You have to look at how it is financed (and the effect it has on debt ratio and cost of capital) and how the stock price relates to its fair value (under priced, correctly priced or over priced) to make a judgment on whether stockholders will benefit or be hurt by the stock buyback. I have a simple spreadsheet that tries to do this assessment that you are welcome to take for a spin.
Back to the Market
Now that we have the tools to assess how and why stock buybacks affect stockholders in the companies involved, let’s use them to look at whether the buyback “binge” in the market is good news, neutral news or bad news, at least in the aggregate. The article in the Economist provides the perspective of those who believe that stock buybacks are the most destructive trend in corporate America. Looking at the value destruction pathways described in the last section, this group believes that the stock buybacks at US companies are increasing leverage to dangerously high levels and/or reducing investment in good projects. But are these contentions true? Let’s check the facts:
1. The leverage story: The notion that US companies are dangerously over levered seems to be built on two arguments: the aggregate debt levels of businesses as reported in the US national accounts and on anecdotal evidence (Apple borrowed money to do buybacks, so every one must...). To examine this argument, I have estimated debt levels at US companies from 1980 to 2013 in the graph below, both as a percentage of capital (book and market) and as a multiple of EBITDA.
It is true that overall financial leverage, at least as measured relative to book value and EBITDA has increased over time (though it has remained relatively stable, as a percent of market value). While this increase can be partially explained by decreasing interest rates over the period, it is worth asking whether buybacks were the driving force in the increased leverage. To answer this question, I compared the debt ratios of companies that bought back stock in 2013 to those that did not and there is nothing in the data that suggests that companies that do buybacks are funding them disproportionately with debt or becoming dangerously over levered.
Companies that buy back stock had debt ratios that were roughly similar to those that don't buy back stock and much less debt, scaled to cash flows (EBITDA), and these debt ratios/multiples were computed after the buybacks.
2. The under investment story: The belief that US companies in sectors other than technology have been reinvesting less back into their businesses is widespread, but let’s check the facts again. In the table below, I look at capital expenditures at US firms collectively, as a percent of revenues and invested capital, from 1980 to 2013:
The trend line (on everything other than cap ex as a percent of sales) does back the conventional wisdom, and since buybacks went up over the same period, the bad news bears seem to win this round, right? Well, not so fast! What if investment opportunities in the US, in sectors other than technology, are drying up, either because of global competition or due to industry maturation? If this is the case, not only should you expect exactly what you observe in the data (less reinvestment, more cash returned) but it is a good thing, not a bad one. Before you get too heated under the collar, there are three things to remember in this debate.
1. The first is that there is little evidence that companies that buy back stock reduce their capital expenditures as a consequence. The table reports on the capital expenditures and net capital expenditures, as a percent of enterprise value and invested capital, at companies that buy back stock and contrasts them with those that do not, and finds that at least in 2013, companies that bought back stock had more capital expenditures, as a percent of invested capital and enterprise value. When you net depreciation from capital expenditures (net cap ex), the two groups reinvested similar amounts, as a percent of enterprise value), but the buyback group reinvested more as a percent of invested capital.
2. The second is that the cash that is paid out in buybacks does not disappear from the economy. It is true that some of it is used on conspicuous consumption, but that is good for the for the economy in the short term, and a great deal of it is redirected elsewhere in the market. In other words, much of the cash paid out by Exxon Mobil, Cisco and 3M was reinvested back into Tesla, Facebook and Netflix, a testimonial to the creative destruction that characterizes a healthy, capitalist economy.
3. The third is the notion that more reinvestment by a company is always better than less is absurd (unless you are a politician), especially if that reinvestment is in bad businesses. In the table below, I have listed the ten companies that were the biggest buyers of their own stock over the last decade (using the Economist's ill advised heading for those who buy back stocks):
As a stockholder in any of these companies, can you honestly tell me that you would rather have had these companies reinvest back in their own businesses? Put differently, how many of you wish that Microsoft had not bought back $100 billion worth of shares over the last decade and instead pumped that money into more Zunes and Surfaces? Or that Hewlett Packard instead of paying out $60 billion to stockholders had bought three more companies like Autonomy (and written them off soon after)? Or that Cisco had spent the $70 billion in buyback money on a hundred small acquisitions? If, as the Economist labels them, these companies are cannibals for buying back their own stock, investors in these companies wish they had more voracious appetites and eaten themselves faster.
There are two other issues brought up by critics of stock buybacks. One is that there is firms may buy back stock ahead of positive information announcements, and those investors who tender their shares in the buy back will lose out to those who do not. The other is that there is a tie to management compensation, where managers who are compensated with options may find it in their best interests to buy back stock rather than pay dividends; the former pushes up stock prices while the latter lowers them. Note that doing a buyback ahead of material information releases is already illegal, and any firm that does it is already breaking the law. As for management compensation, I agree that there is a problem, but buybacks are again a symptom, not a cause of the problem. In my view, it is poor corporate governance practice on the part of boards of directors to grant huge option packages to managers and then vote for buybacks designed to make managers even better off. Again, fixing buybacks does nothing to solve the underlying problem.
Wrapping up
I think that both ends of the spectrum on buybacks are making too much of a simple cash-return phenomenon. To the boosters of buybacks as value creators, it is time for a reality check. Barring the one scenario where companies that buy back stock stop making value-destructive investments, almost every other positive story about buybacks is one about value transfers: from taxpayers to equity investors (when debt is used by an under levered firm to finance buybacks) and from one set of stockholders to another (when a company buys back under valued stock).
To those who argue that buybacks are destroying the US economy, I would suggest that you are using them as a vehicle for real concerns you have about the evolution of the US economy. Thus, if you are worried about insider trading, executive compensation, tax-motivated transactions and or under investment by the manufacturing sector, your fears may be well placed, but buybacks did not cause of these problems, and banning or regulating buybacks fall squarely in the feel-good but do-bad economic policy realm.
Is it possible that some companies that should not be buying back stock are doing so and potentially hurting investors? Of course! As someone who believes that corporate finance at many companies is governed by inertia (we buy back stock because that is what we have always done...) and me-too-ism (we buy back stock because every one else is doing it...), I agree that there are value destroying buybacks, but I also believe that collectively, buybacks make far more sense than dividends as a way of returning cash to equities. In the Economist article, I am quoted as saying that dividends are a throwback to the nineteenth century (not the twentieth), when stocks were offered as investment choices to investors who were more used to bonds and that fixed, regular dividends were designed to imitate coupons. Since equity is a residual claim, it is not only inconsistent to offer a fixed cash flow claim to its owners, but can lead (and has led) to unhealthy consequences for firms. In fact, I think firms are far more likely to become over levered and cut back on reinvestment, with regular dividends that they cannot afford to pay out, than with stock buybacks.
Nguồn: finandlife|Damodaran