Understanding the cycle may suggest what to expect as the economy recovers.
FIDELITY VIEWPOINTS – 06/19/2020
Key takeaways
ü Stock market sector returns may be affected by the phases of business cycle.
ü History can offer guidance as to how sectors might perform during each phase.
ü Consumer discretionary and industrials sectors tend to outperform in the early cycle.
Corporate earnings, interest rates, inflation, and other factors that change as economies expand and contract can affect the performance of sectors of the stock market. For investors interested in an active approach to managing their stock portfolios, understanding how those sectors have historically performed at various points in the business cycle may help identify opportunities.
Understanding the cycle may enable investors to evaluate and adjust their sector exposure, as the likelihood of a shift from one phase of the cycle to the next increases. This differs from both short-term tactical and long-term strategic approaches to investing because the business cycle historically has played out over an intermediate time horizon with transitions between cycle phases taking place every few months or years on average.
Fidelity's Asset Allocation Research Team believes long-term historical average returns provide reasonable guidance for allocating assets in investment portfolios. However, over periods of 30 years or less, short-, intermediate-, and long-term factors may cause performance to deviate significantly from those averages, so analyzing factors and trends over shorter time periods can also be an effective approach to asset allocation.
Investment performance is driven by short-, intermediate-, and long-term factors
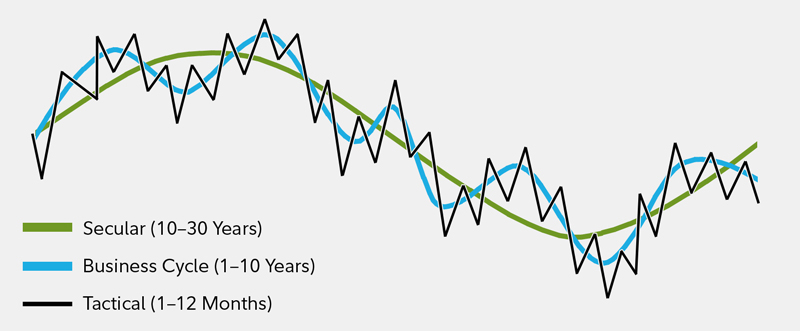
This chart shows that asset performance is driven by a confluence of various short-, intermediate-, and long-term factors.
For illustrative purposes only. Source: Fidelity Investments, Asset Allocation Research Team (AART).
Understanding business cycle phases
Every business cycle is different, but certain patterns have tended to repeat over time. Changes in the cycle reflect changes in corporate profits, credit availability, inventories of unsold goods, employment, and monetary policy. While unforeseen macroeconomic, political, or environmental events can sometimes disrupt a trend, these key indicators have historically provided a relatively reliable guide to recognizing the phases of the cycle. Bear in mind, though, that the lengths of time each phase has lasted has varied widely.
Currently, the US and many other economies are in an unusual recession in which government policy responses to the COVID-19 pandemic have played a significant role in terms of both impacting economic activity and supporting financial markets.
A typical business cycle contains 4 distinct phases.
Early cycle: Generally, a sharp recovery from recession, as economic indicators such as gross domestic product and industrial production move from negative to positive and growth accelerates. More credit and easy monetary policy aid rapid profit growth. Business inventories are low, and sales grow significantly.
Mid cycle: Typically the longest phase with moderate growth. Economic activity gathers momentum, credit growth is strong, and profitability is healthy as monetary policy turns increasingly neutral.
Late cycle: Economic activity often reaches its peak, implying that growth remains positive but slowing. Rising inflation pressures and a tight labor market may crimp profits and lead to tighter monetary policy.
Recession: Economic activity contracts, profits decline, and credit is scarce for businesses and consumers. Monetary policy eases and inventories gradually fall despite low sales, setting the stage for recovery.
How stocks have performed during each phase
Historically, different sectors of the stock market have taken turns delivering the highest returns as the economy has moved from one stage of the cycle to the next.1 Due to structural shifts in the economy, technological innovation, regulatory changes, and other factors, no sector has behaved uniformly through every cycle. However, some sectors have consistently outperformed while others have underperformed, and knowing which is which can help investors set realistic expectations for returns. So far in 2020, the COVID-19 pandemic has had a significant impact on sector performance.
Looking at sectors throughout the business cycle
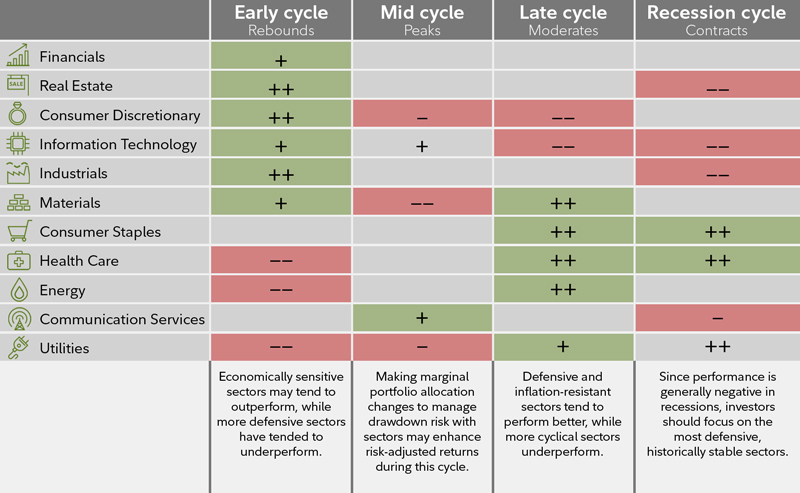
This chart looks at different sectors throughout the business cycle.
Note: The typical business cycle shown above is a hypothetical illustration. There is not always a chronological progression in this order, and in past cycles the economy has skipped a phase or retraced an earlier one.
Source for sector performance during business cycle: Fidelity Investments (AART). Unshaded (white) portions above suggest no clear pattern of over- or underperformance vs. broader market. Double +/– signs indicate that the sector is showing a consistent signal across all three metrics: full-phase average performance, median monthly difference, and cycle hit rate. A single +/– indicates a mixed or less consistent signal. Returns data from 1962 to 2016. Annualized returns are represented by the performance of the largest 3,000 US stocks measured by market capitalization, and sectors are defined by the Global Industry Classification Standard (GICS®). Past performance is no guarantee of future results. See below for important information.
Stocks in the early cycle
Since 1962, stocks have delivered their highest absolute performance during the early cycle, with an average total return of more than 20% per year during this phase, which has lasted roughly one year on average. Sectors that typically benefit most from low interest rates—such as consumer discretionary, financials, and real estate—historically have outperformed. Consumer discretionary stocks have beaten the broader market in every early cycle since 1962.
Industries that typically benefit from increased borrowing—including diversified financials, autos, and household durables—have also been strong performers.
Economically sensitive sectors—such as industrials and information technology—have historically rallied as recession turned to recovery, with industries including transportation and capital goods gaining in anticipation of economic recovery. Information technology and materials stocks typically have been aided by renewed consumer and corporate spending expectations.
Early-cycle laggards include communication services and utilities, which generally see fairly consistent demand. But while communication services has historically underperformed, its evolving mix of industries raises questions about whether it will do so in the future. Energy stocks also have lagged during the early phase, when inflationary pressures and energy prices tend to be lower.
Stocks in the mid cycle
As the economy has moved beyond its initial recovery and growth has moderated, interest rate and economically sensitive sectors have still performed well, but stocks of industries that see peak demand for their products or services only after the expansion has become more firmly entrenched have also delivered strong returns. Average annual stock market performance has tended to be fairly strong at roughly 15%, though not as strong as in the early cycle.
Information technology has been the best performer during this phase, with industries such as semiconductors and hardware typically picking up momentum once companies gain confidence in the stability of the recovery and become willing to make capital expenditures. We expect the communication services sector to outperform during mid cycle, largely due to the strength of the media industry during this phase.
The materials and utilities sectors have been the biggest underperformers.
The mid cycle tends to be longer than any other stage (roughly 3.5 years on average), and is also when most market corrections have taken place. For this reason, sector leadership has rotated frequently. No sector has outperformed or underperformed the broader market more than 75% of the time, and the magnitude of the relative performance has been modest compared with the other 3 phases.
Because no sector consistently outperforms in the mid cycle, investors may want to consider keeping sector bets to a minimum while employing other approaches to seek opportunities.
Stocks in the late cycle
The late cycle has historically lasted an average of a year and a half, and overall stock market performance has averaged an annualized 6%. The energy and materials sectors have previously done well as inflationary pressures build and the continuing expansion helps maintain demand.
Sectors where revenues are tied to basic needs—such as health care, consumer staples, and utilities—generally have performed well.
Information technology and consumer discretionary stocks have lagged during this phase, as inflationary pressures crimp profit margins and investors move away from the most economically sensitive areas.
Stocks in recession
Recession has historically been the shortest phase—lasting slightly less than a year on average—and stocks have performed poorly (-15% average annual return).
As growth contracts, economically sensitive sectors lose favor, and defensive ones perform better. Among these are consumer staples, utilities, and health care, including industries producing items such as toothpaste, electricity, and prescription drugs, which consumers are less likely to cut back on during a recession. In a contracting economy, these sectors' profits are likely to be more stable than those of others. The consumer staples sector has a perfect track record of outperforming the broader market during recessions.
High dividend yields paid by utility and telecom companies have helped these sectors during recessions. Interest-rate-sensitive sectors—including industrials, information technology, and real estate—typically have underperformed the broader market during this phase.
While every business cycle is different, an approach to investment analysis that identifies key phases in the economy may offer investors guidance as they seek returns from their allocation to stock sectors.